Performance & analytics
Which stores or products need attention? What sits behind the result?
Use sales, stock, store and shelf performance to surface material changes, then open the product, store, range or planogram context that helps explain them.
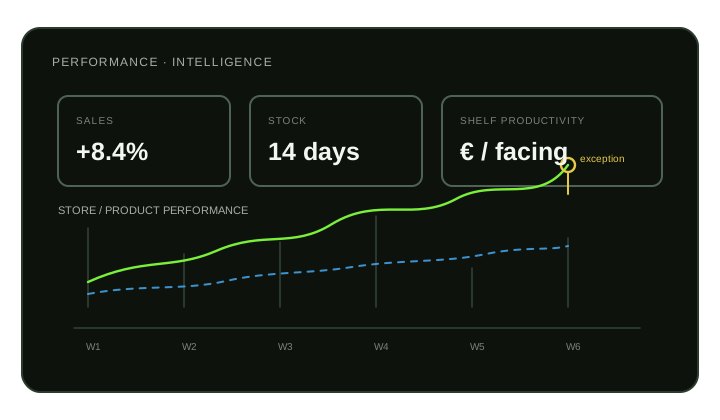
A dashboard is less useful when the team can see a result but cannot quickly get back to the store, product, shelf plan or operating decision behind it.
Surface the exception, then take the manager back to its context.
Turn sales, stock, space and field evidence into practical business intelligence (BI) for the next range, planogram and execution decision. ShelfGrid’s live analysis foundation includes dashboards, store-scoped analytics, category performance, facings return, demand forecasting and anomaly views. The value grows as wider plans, execution and outcomes are retained alongside them.
How it works
Measure → compare → surface → review.
Load sales, stock and distribution into a reusable analytical model.
View performance by store, product, period and category.
Use dashboards, facings return, forecast and anomaly views to reveal material changes.
Take the finding back into the relevant range, planogram or operating review instead of stopping at the report.
Analysis across stores, products, categories and planograms.
The live product contains the analytical components needed to measure sales, stock, category performance and shelf productivity. Fuller operating-history intelligence depends on the broader workflows being extended or validated.
- Widget-based dashboards backed by reusable query endpoints.
- Store-level analytics and product breakdowns.
- Category performance rollups from data held by store and period.
- Facings return per planogram.
- Demand forecast and anomaly snapshots in the current build.
The management questions
Start with the question, not the dashboard.
Use the current analytics to find what changed; as more operating history becomes available, open the record that helps explain why.
Which products or stores are underperforming and what range or planogram applies there?
Which placements or assets need attention and what happened at that location?
Where does work repeatedly require correction and which issue remains unresolved?
Which risks received late action and where does a later claim conflict with the earlier history?
Current product
Measure sales, stock and category performance.
Use current dashboards, store and category analysis, facings return, forecasting and anomaly views to focus attention on material changes.
Extending / validating
Connect more results to the operating history behind them.
As broader plans, placements, execution, cases and outcomes are retained, they can support explainable accountability and recommendations. That fuller intelligence model is not presented as completed live capability.
Continue

Start with the questions your teams already ask.
See which current data and operating context can make the answer more useful.